Introduction
About 5 years ago there was several places to check for information while debugging issues. Some errors would trigger email to be sent to a specific email inbox while others would be routed to a more generic inbox. We also had EC2 instances with access logs / error logs from Apache, some services would get data into AWS CloudWatch or Slack. Lastly, we also had some usage of AWS Elastichsearch. Mainly from the Python team which composes a smaller surface of the company and managed to get better logs faster than the rest of the organization. But even then, there was only 1 way to get data into Elasticsearch: via an SQS Queue.
You see, we have one of those so-called AWS Classic Account which existed before VPC was ever a thing. And in that account we have 1 SQS Queue which is worked by a Logstash container on a newer and limited account that holds AWS Elasticsearch and some other things.
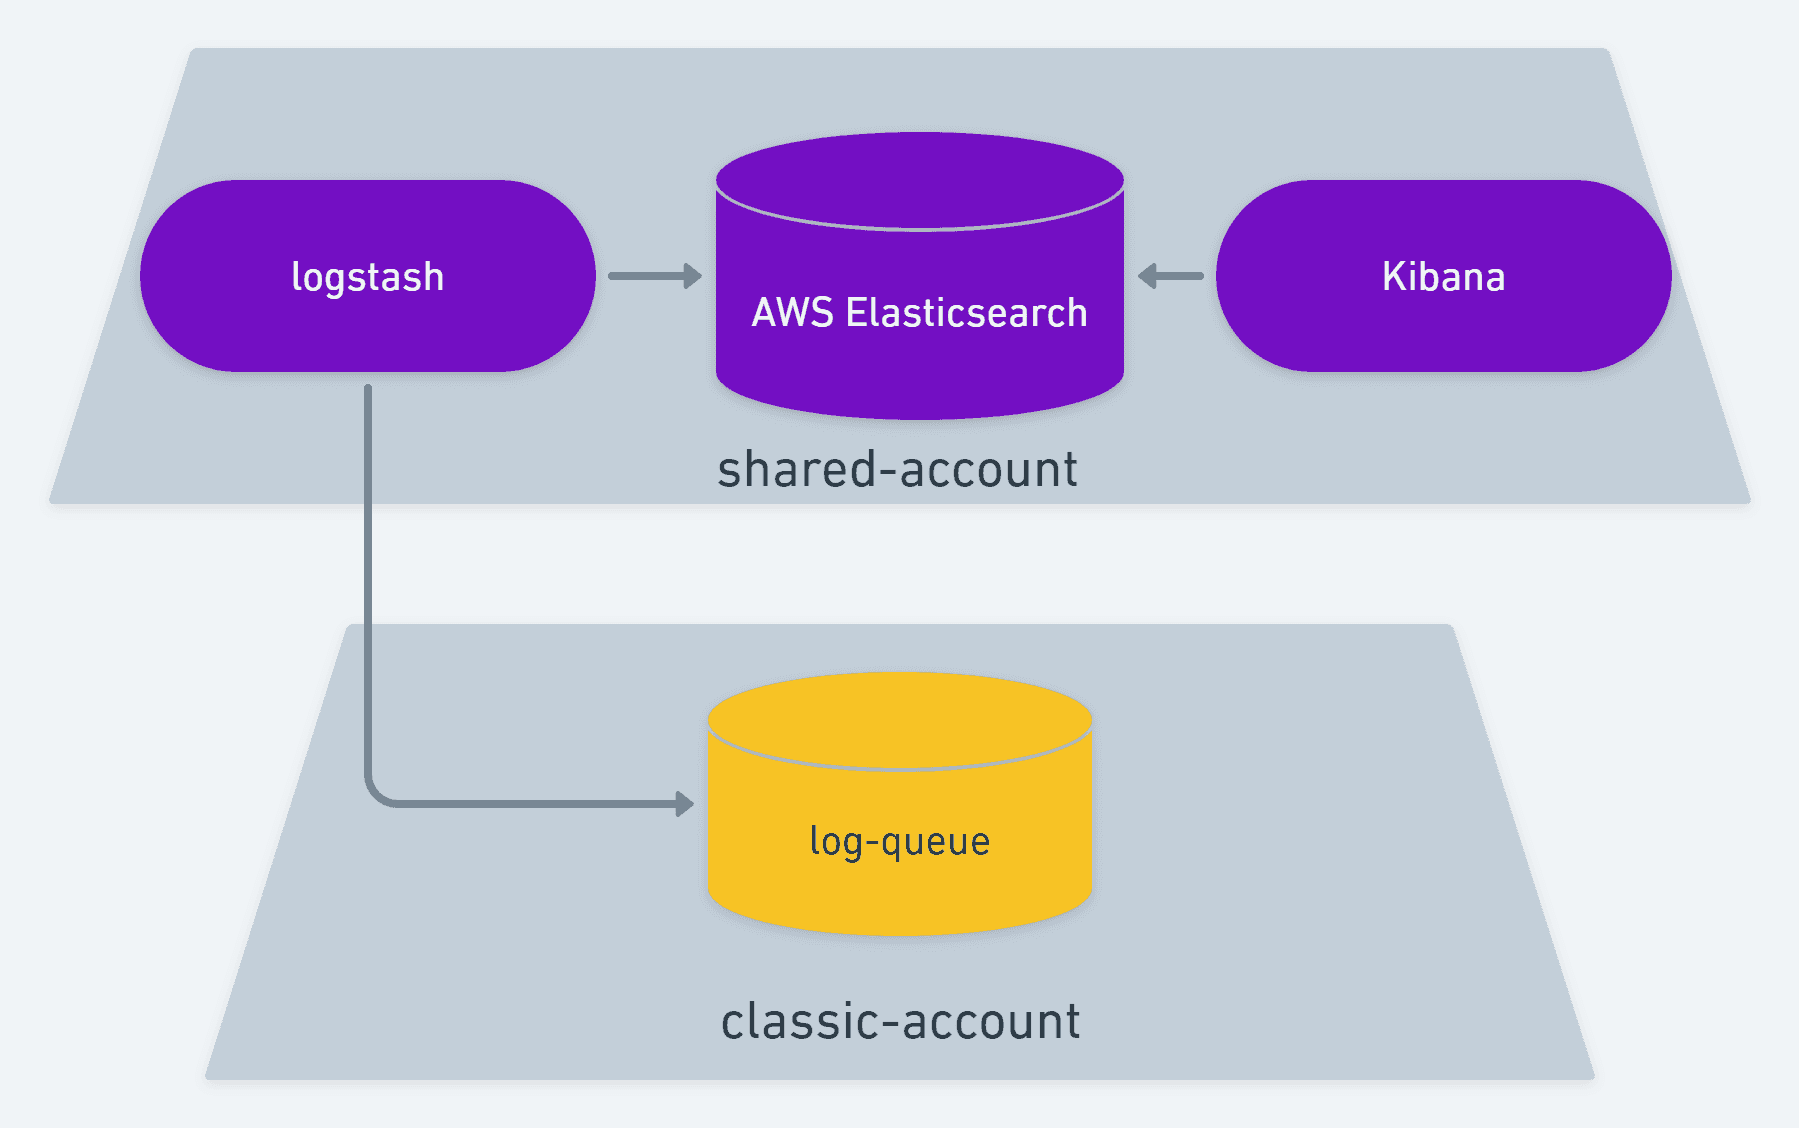
Over the course of 4 years we tried to move as much as we could to this exact same setup. Pretty much replace code that was writing an email or a log file with code that would write an SQS message so that data would show up on Kibana. We got pretty far with this and it started helping immensely not having to dig through multiple places to dig up what happened in the lifecycle of issues that we were debugging. In time we had no more slack messages, emails or log files. We moved everything to a CI/CD strategy that would deploy containers on Fargate and write logs to stdout / stderr which would lead to logs showing up on CloudWatch. For quite some time we have been going back and forth between only Elaticsearch and CloudWatch for debugging. Elasticsearch would hold data that usually meant code execution was intact, but still data configuration could lead to unexpected behaviors. CloudWatch is where crashes and fatal errors would live, along with Apache Error Logs.
About 4 months ago I started on my spare time to work on the next step to improve even further this setup and this post will dive into the ins and outs of this journey I took. I'm pretty happy with the result and even though there are some improvements to be made, I feel I accomplished something quite nice.
I actually wanted metrics
First off, I didn't start this journey because I wanted to improve logs. That was just a side effect. I actually wanted to collect metrics. For the past 2 years I've been working on a brand new API-based Laravel project where I either complete rewrite / redesign an existing report or I write a new reporting capability on top of our existing database. This work requires a lot of advanced SQL query specially because there's lot of table designs which cannot be changed without breaking 12 years worth of software. I've been pretty successful with this project and as of today, nearly 45% of all our reporting features run on top of this service. I felt like I wanted to collect some metrics out of it.
- Which are the most used reporting functionalities?
- Which customer uses the most out of our database CPU?
- How long does the average report take per API?
- How long does the average report take per customer?
- Are there any users that has a much higher than normal usage?
To answer these questions, I looked into a lot of options. The first one I got really close was AWS X-Ray. I even wrote a dummy AWS X-ray instrumentation for PHP. X-Ray allows up to 50 indexable fields on a trace, which we can then use for filtering or group by aggregates. It's a pretty sweet service that tackles what I wanted but with an impossible limitation for my use case: only 6 hour window aggregates. I could not ask X-Ray to sort the most used report API in the last 2 weeks or group the number of API calls by tenant for the last month. X-Ray is strongly tied to debugging live systems and not collecting metrics.
I also looked into Sentry. Sentry is a pretty good service with support for all major programming languages and even frameworks. It has logging capabilities as well as APM (Application Performance Monitoring). However, they don't have UDP support like X-Ray does. The context I was working from was that I wanted to collect metrics from a reporting service. I wanted to spend as little overhead as possible with collecting these metrics and never fail any report because the APM service failed. On top of that, I got some resistance from management because I was gonna introduce yet another log solution into the stack and soon we would have CloudWatch, Elasticsearch and Sentry to look into. Not to mention that the APM functionality of Sentry didn't seem to be what I wanted either. I'm not really looking into memory, cpu, etc. I'm looking for users, customers, number of executions and average API duration. In my context, one user belongs to a customer and each customer has a high range of users.
Lastly I looked into Prometheus. If you heard about Prometheus you know that it offers an interesting approach where services write logs to a local scope with little or no overhead at all and a separate service managed by Prometheus is supposed to consume that. However, the reporting service I'm focusing is running on AWS Lambda with Bref. AWS Lambda is as ephemeral as it gets. Other services are also running as a container on Fargate. Although they're not so limited as AWS Lambda, it's still a closed environment which I don't want to be customizing so much to get metrics and logs.
AWS Lambda metrics are also pretty good, but they don't allow me to slice the data into users or customers. Services not running on AWS Lambda don't have that dashboard either.
Kibana was starring at me the whole time
One day my manager presented some Kibana charts that showed a huge drop on execution time from a change made by the Python team. it was one of those basic charts that comes in the Discovery of Kibana containing the aggregate number of execution and columns over periods of time. I remember clear as day how that was exactly what I wanted. Count or Average some Elasticsearch records over time. All I need to do is learn about ELK. After watching a few videos on 2x speed on Pluralsight I understood the bare basic:
- Elasticsearch is a database
- Kibana is a web service that acts as the frontend of Elasticsearch
- Logstash is a background worker that prepares data and ingest it into Elasticsearch.
With that in mind, I quickly learned that Logstash had support for TCP and UDP. That meant I could collect metrics using UDP while write logs using TCP. Kibana would then allow me to filter on any field, aggregate number of execution and group by customers or users. Everything I wanted in one place.
ELLLLK or E4LK
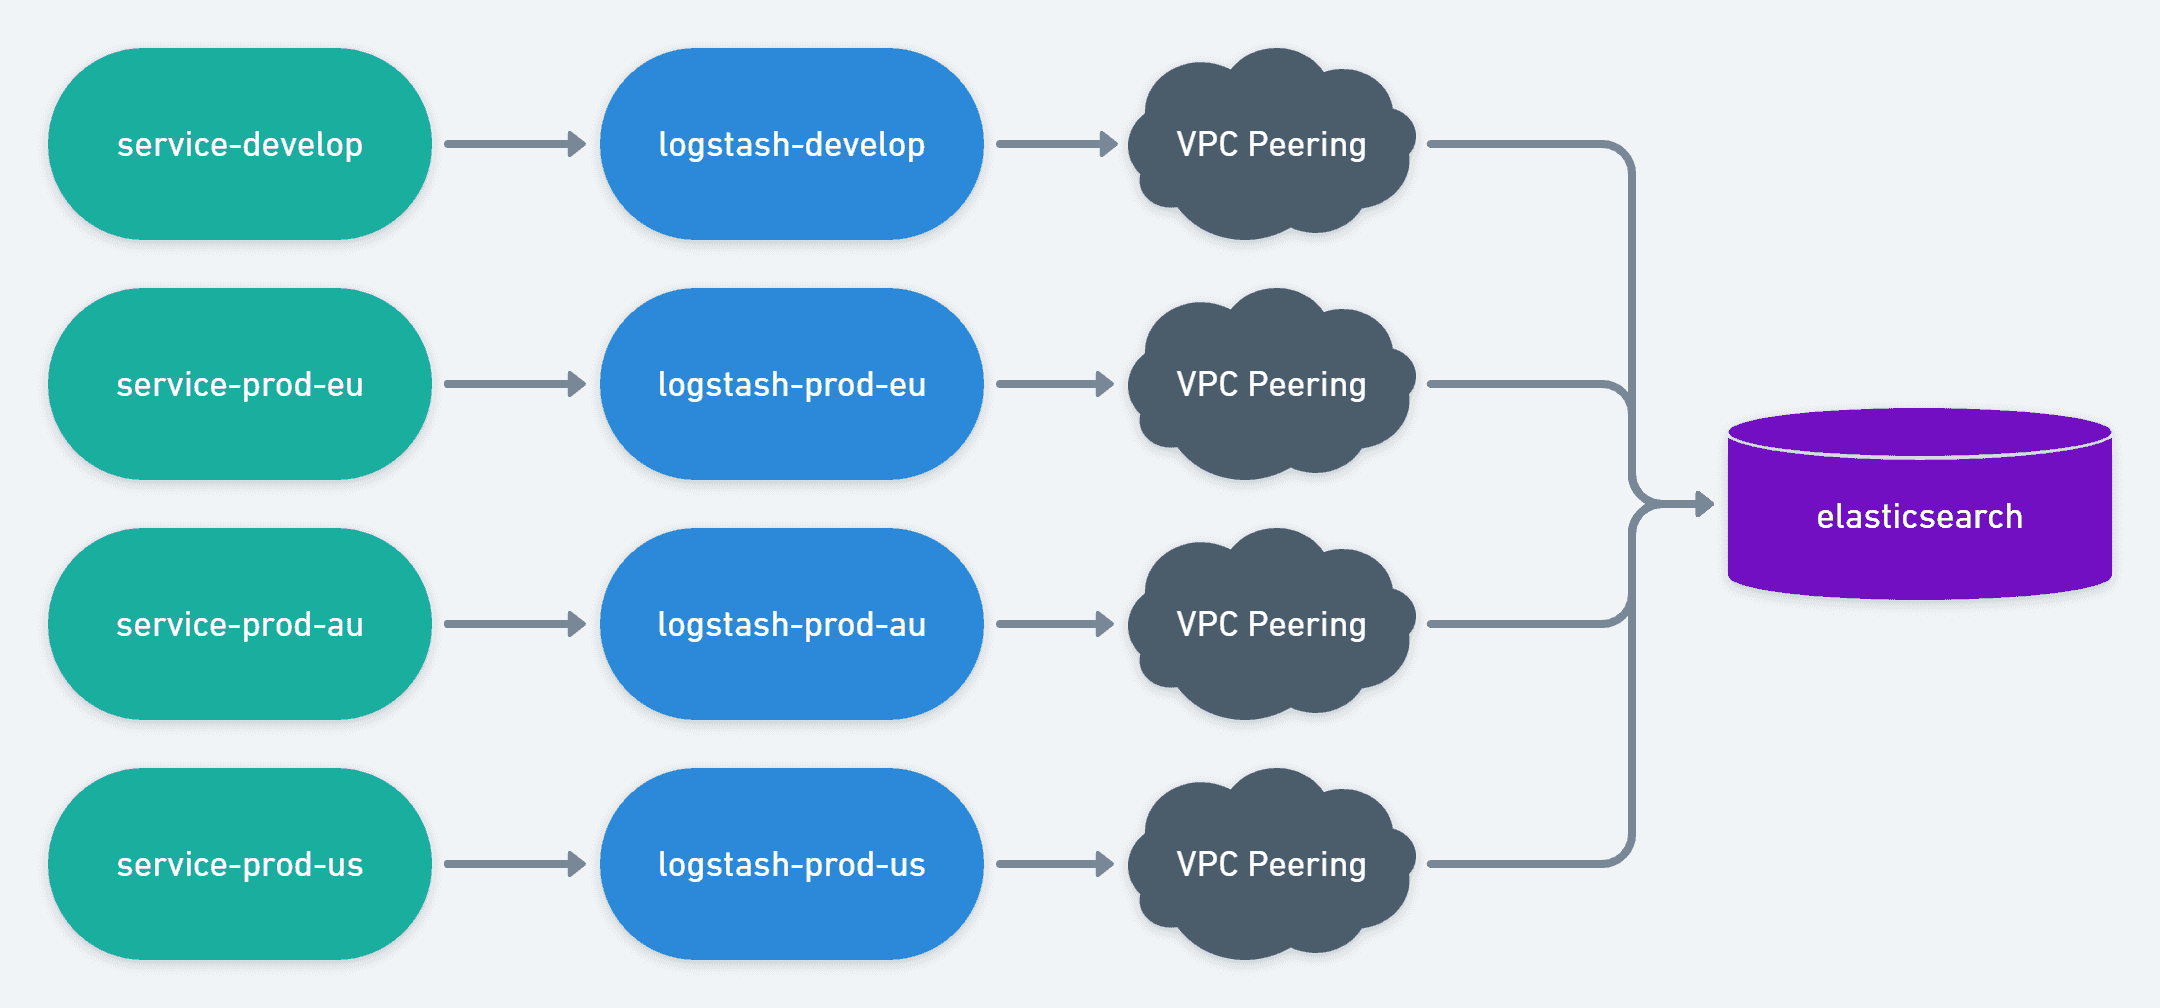
If you remember from the introduction, we already have an Elasticsearch cluster on a shared account, a Logstash container working an SQS queue and Kibana up and running. But for the purpose of collecting metrics, I didn't want to write an SQS message because of the HTTP/TCP overhead that it brings. I also didn't want services running in US or Australia establishing a connection with a compute resource in Europe, be that an SQS Queue or Logstash. That's when I came up with the idea of running one Logstash per region.
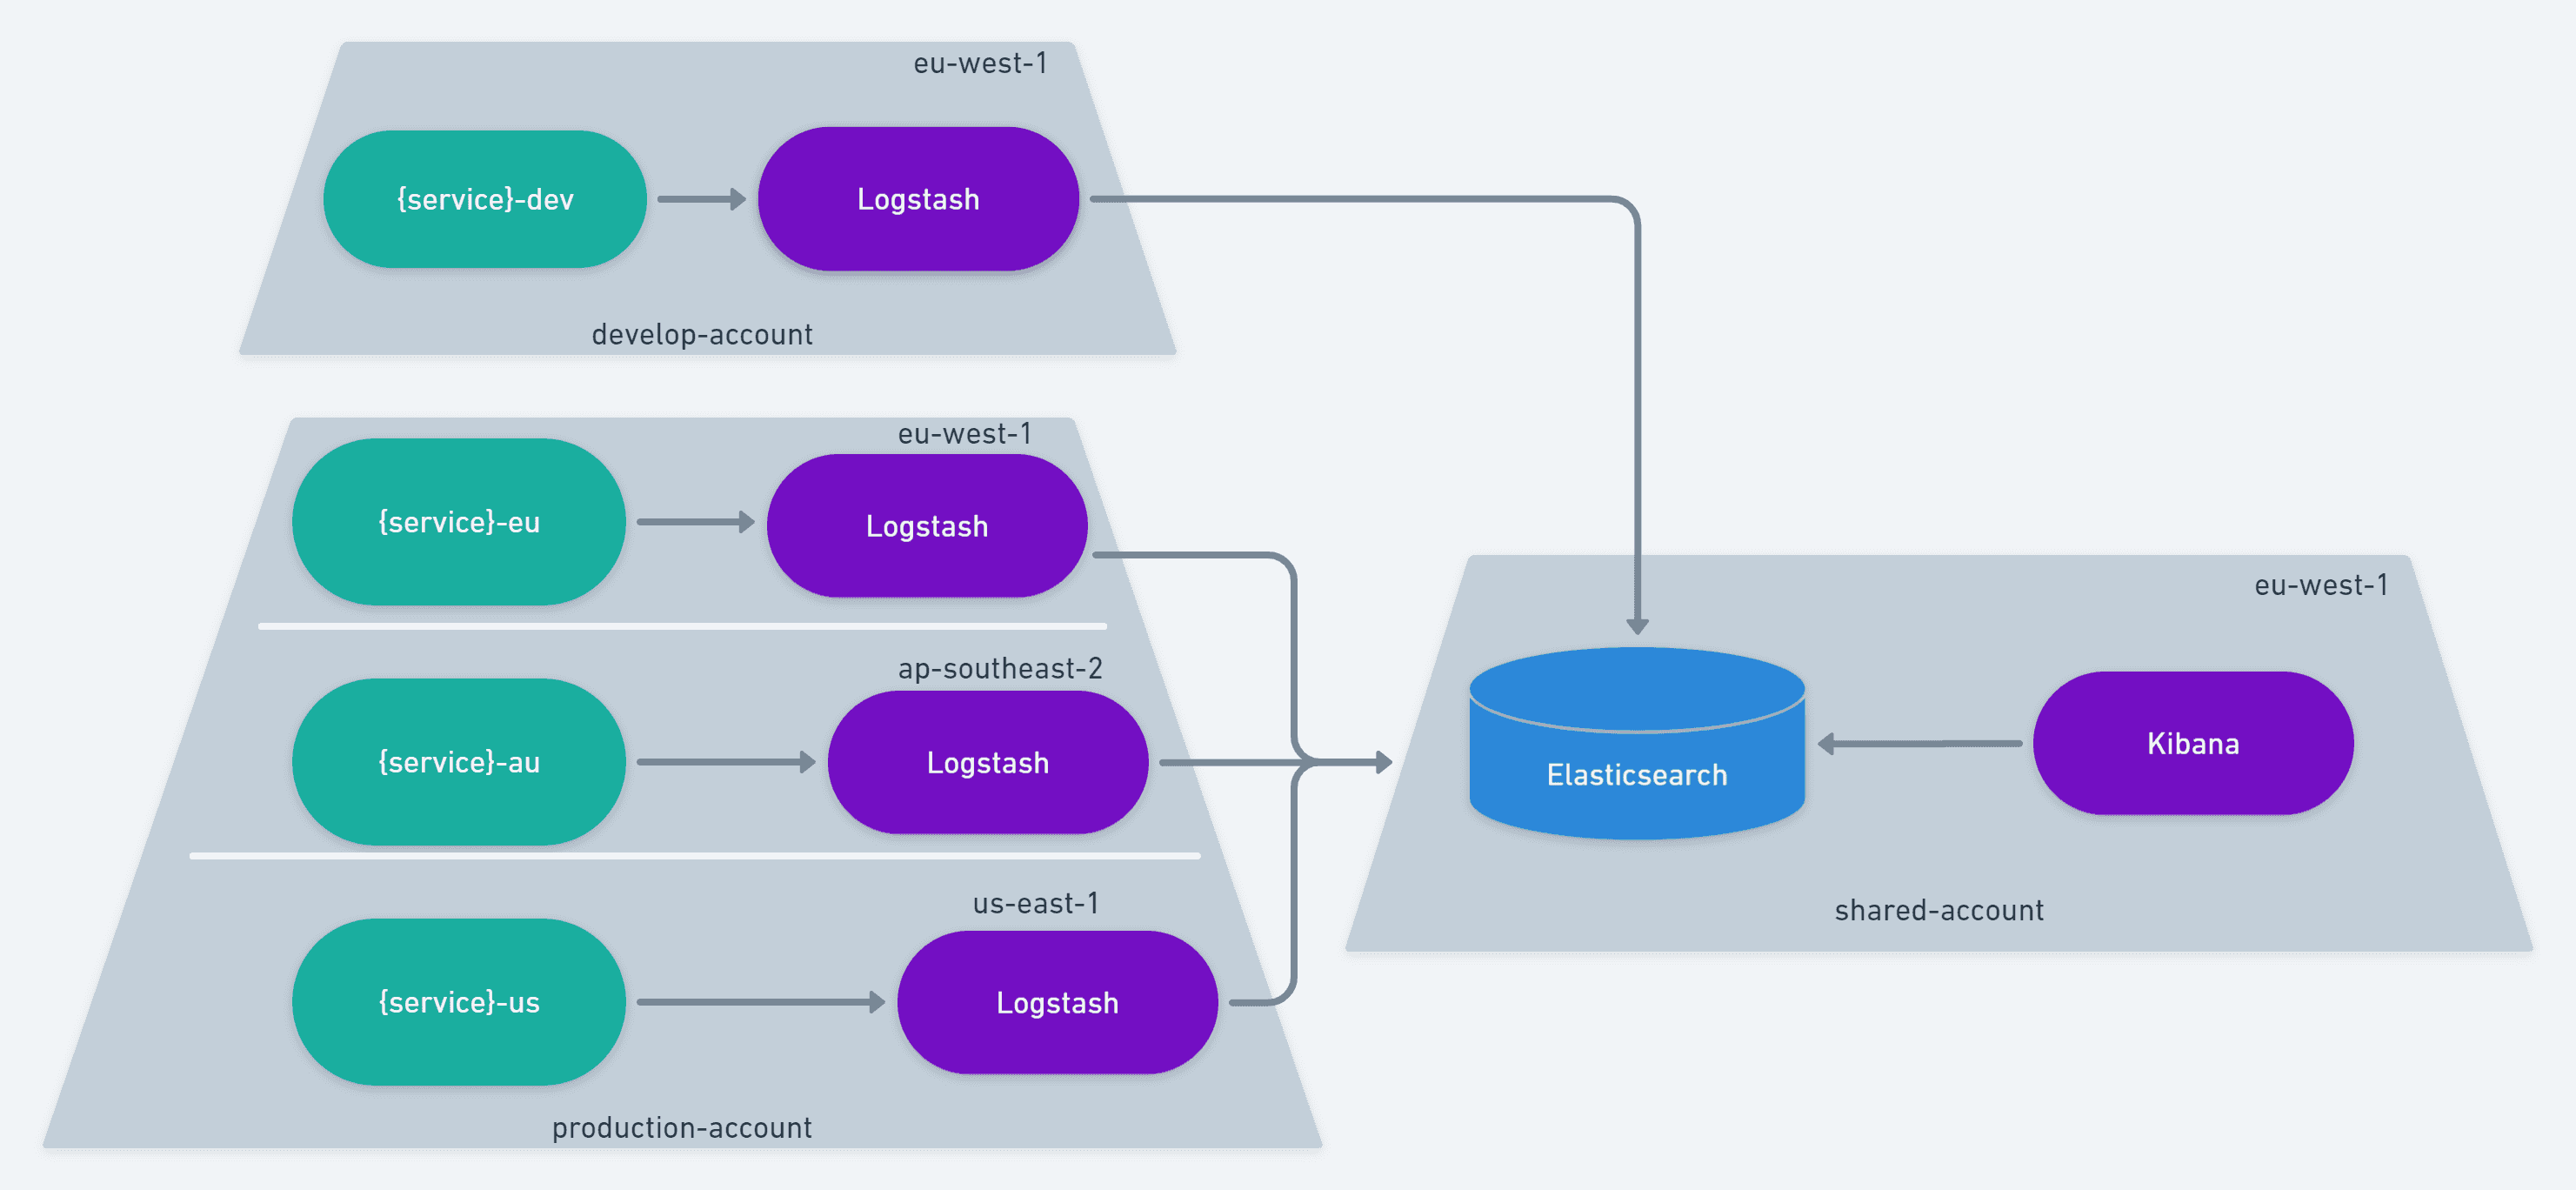
The amazing thing about this setup is that services can be Fargate containers or Lambda functions and they'll still talk to the same Logstash container. Their communication overhead will be "region-local" and the cross-region communication will be left for Logstash to handle. That means services already moved on and finished their execution with as little delay as possible. Services wishing to write a log message can do so using a TCP connection with the Logstash container while services wishing to gather metrics can do so using a UDP connection. We end up with the capability of collecting metrics while improving the performance of writing logs and reducing or erasing the SQS cost of writing logs.
In the end we have 4 Logstash containers running on Fargate with 1 Elasticsearch cluster and 1 Kibana.
The Logstash Configuration
A sample of the logstash configuration can be found here: https://github.com/cgauge/laravel-logstash-apm/blob/main/docker/amazon.logstash.conf
It looks like this:
input {
  tcp {
    port => 9601
    codec => json
  }

  udp {
    port => 9602
    codec => json
  }

  sqs {
    queue => "${LOGSTASH_FALLBACK_QUEUE}"
    id_field => "sqs_id"
    polling_frequency => 20
    region => "${LOGSTASH_FALLBACK_QUEUE_REGION}"
    threads => 1
  }

}

filter {
  mutate {
    remove_field => ["path", "host", "port"]
  }
}

output {
  amazon_es {
    index => "logstash-%{service}-%{+YYYY.MM.dd}"
    hosts => ["${ELASTICSEARCH_HOST}"]
    region => "${ELASTICSEARCH_REGION}"
  }
}
This configuration exposes 1 port for a TCP connection and 1 port for a UDP connection. It sets AWS Elasticsearch as the destination and it also includes an SQS as a fallback functionality. The SQS fallback will not be used when collecting metrics as it's better to lose them instead of causing execution delays. However, if something goes wrong and we need logs to be written, then we want to make a best effort that these logs will be written. In case the Logstash container is unreachable, we can then write the log into an SQS queue and let Logstash pick it up. Yes, it's similar to what we already had, but this is a last resort that
- will rarely be used
- provides a region-specific queue and
- guarantees a best-effort in writing logs.
Deploying Logstash
AWS ECS has integration with Route 53 for private DNS.
We can use Service Discovery to attach a DNS onto the private
IP address of the container. This means services can simply
talk to logstash.internal and AWS will make sure that
this DNS resolves to the private ip address of the Logstash
container. If more than 1 container is running on ECS,
AWS will offer a simple load balacing capability resolving
one IP at a time.
The CloudFormation template to deploy this Logstash container can be found here: https://github.com/cgauge/laravel-logstash-apm/blob/main/amazon/logstash/template.yaml
VPC Peering
If things can go wrong, they will go wrong. For this project, VPC Peering was the cherry on the cake that almost blew up the entire project. AWS Elasticsearch is running behind a VPC on our "shared account" and is unreachable from the internet. This means that we need VPC peering to establish connection between all 3 production VPC and the develop VPC with the Elasticsearch VPC.
However, AWS VPC does not let we peer 2 VPCs with the same CIDR. That would make it impossible for them to route traffic from point A to point B reliably because they would not be able to tell if e.g. 10.0.15.31 belongs to VPC A or VPC B.
Fortunately the people that had setup our VPC thought about potential peering and had each region using a different CIDR. The "shared-account" with Elastisearch also had one separate CIDR. However, the develop account runs only on Europe and it clashes with our production account Europe. In other words, it's impossible to have our develop account and our production account peering with our shared account at the same time.
The good thing about ELK is that it's a 3 node communication:
- Service communicates with Logstash.
- Logstash communicates with Elasticsearch.
That means for our develop account only we can setup an extra VPC only for Logstash.
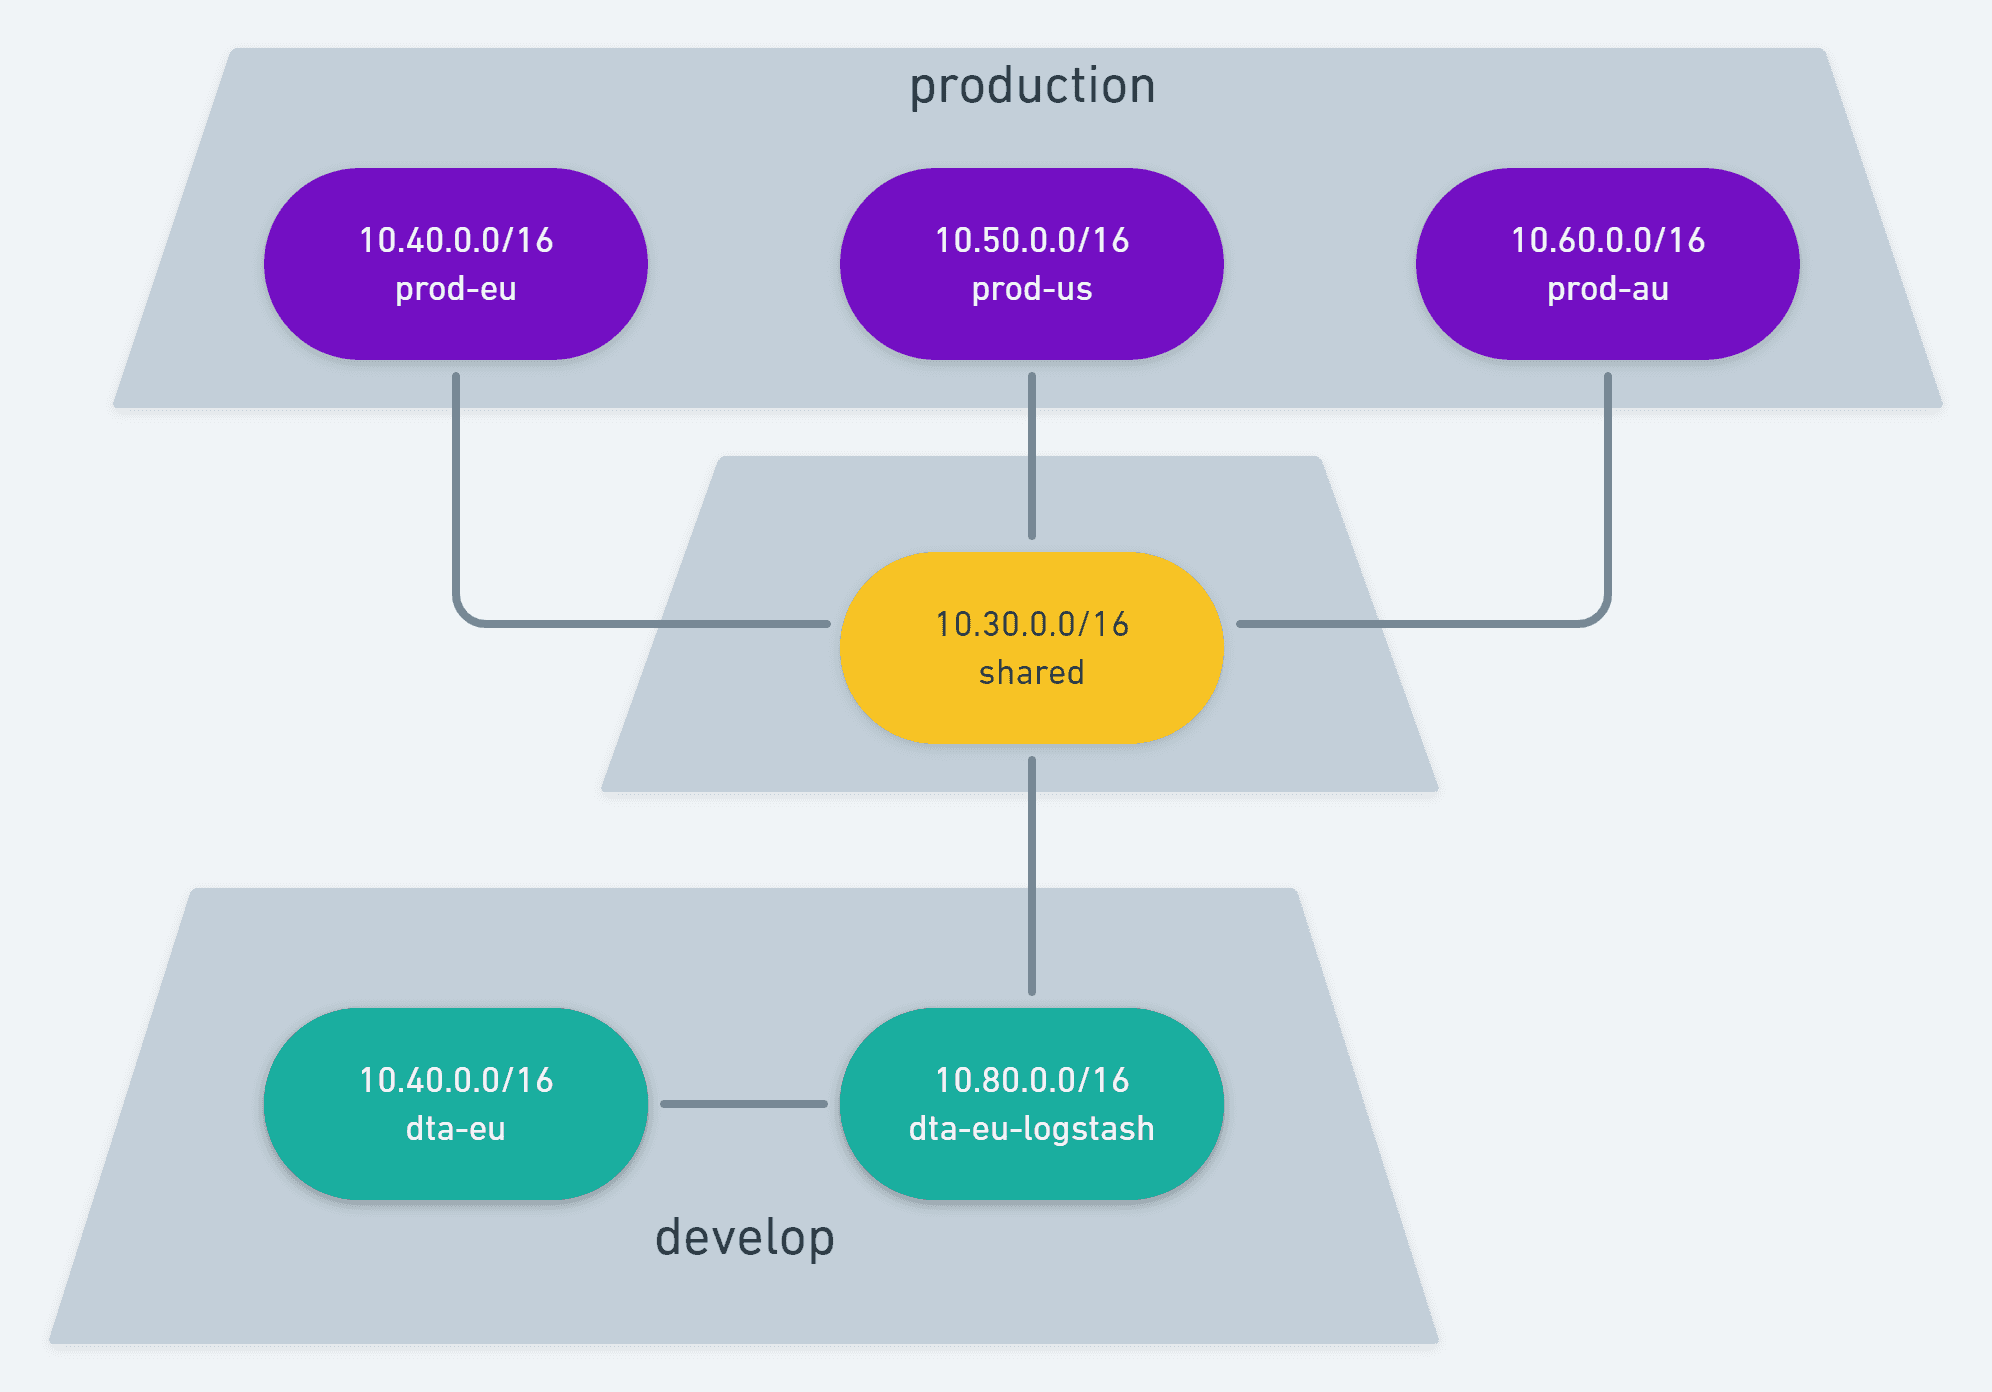
This means that develop will have 2 VPCs and will peer the services VPC with the Logstash VPC. We will never be able to pull data from Elasticsearch this way, but since it's only meant for Logs and Metrics, that's an acceptable limitation. Services will talk to Logstash via a VPC peering which will then talk to Elasticsearch via another VPC peering. The production account will not have any of this mess.
Maybe one day we'll recreate the entire develop account and get rid of this quirk, but right now we think that it's not worth the weeks worth of effort to delete everything so that we can delete and recreate the VPC and then recreate over 30 fargate containers and 50 lambda functions that make up our AWS account.
Conclusion
After extensive research on multiple approaches, some fast failures and lots of studying, I got Logstash up and running on all our production regions and started collecting metrics via UDP. It already helped us diagnose some internal DoS issues as well as some Aurora / Elasticache DNS issues. We're able to make better decisions driven by customer usage. Data never leaves AWS infrastructure for compliance. No personal identifiable information is stored on Elasticsearch. Data gets automatically cleaned up after 30 days. AWS manages the Elasticsearch Cluster. Kibana provides great visualization for the metrics collected. Fargate and Lambda services are able to write logs in a single, reliable channel / format. PHP, Python and NodeJS are able to talk to Logstash if those teams decide to make use of this solution. The VPC 'quirk' on the develop account isn't really relevant for developers. The whole infrastructure works wonderfully.
Hope you enjoyed the reading as much as I enjoyed building this. Talk with me on Twitter.
Cheers.